CIM plot graphical output issue

Dear mixOmics team,

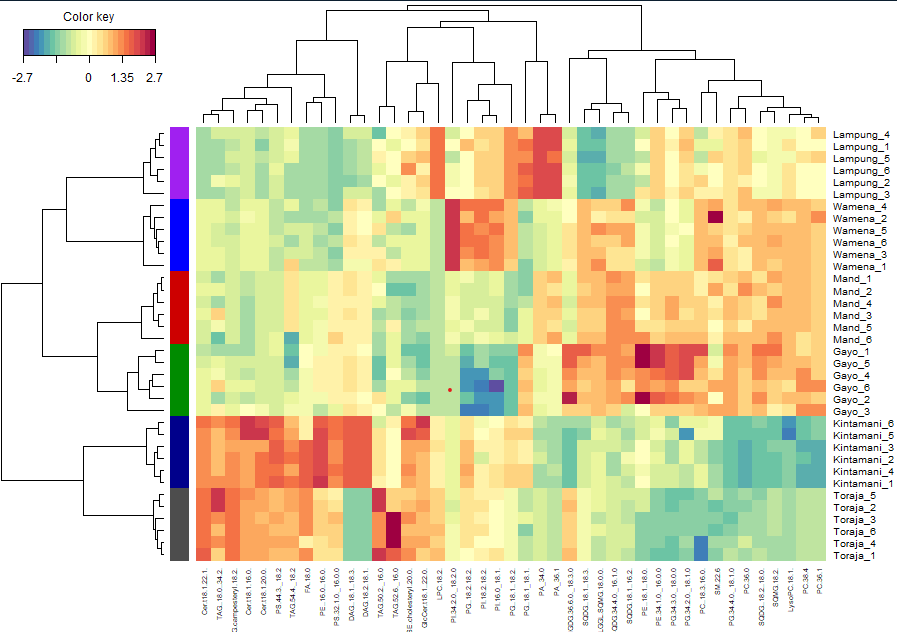
I have a technical issue related to CIM graphical output, the colnames is truncated due to lack of space. I am not sure this is the issue in my PC only, or in my Rstudio.
Please see this picture, the issue is on the variable name.
Can it be tilted to 45 degree, to make it seen more clearly?

Thank you for supporting us.

Hi @aurum,

The cim function has a margins arugment, that should solve your problem. You could try with margins = c(7, 5). You can also change the size of the labels using the col.cex argument.

Best wishes
Christopher

Hi Christopher,

Its work smoothly. Thanks a lot.
Cheers!

Hi again,

The variable below the heatmap is lipid species, so usually it uses this kind of character i.e., () / ;

But, in the figure it can not be read as it is. Do you have any solution?

Regards

Hi @aurum,

the variable names cannot contain backslash "\" as it is a system-reserved character. You can also double all of backslashes (e.g. "f\oo" -> "f\\oo")

Best,
Al
Al

OK thats fine, anyway you guys developing something superb!

Thanks a lot